
TL;DR
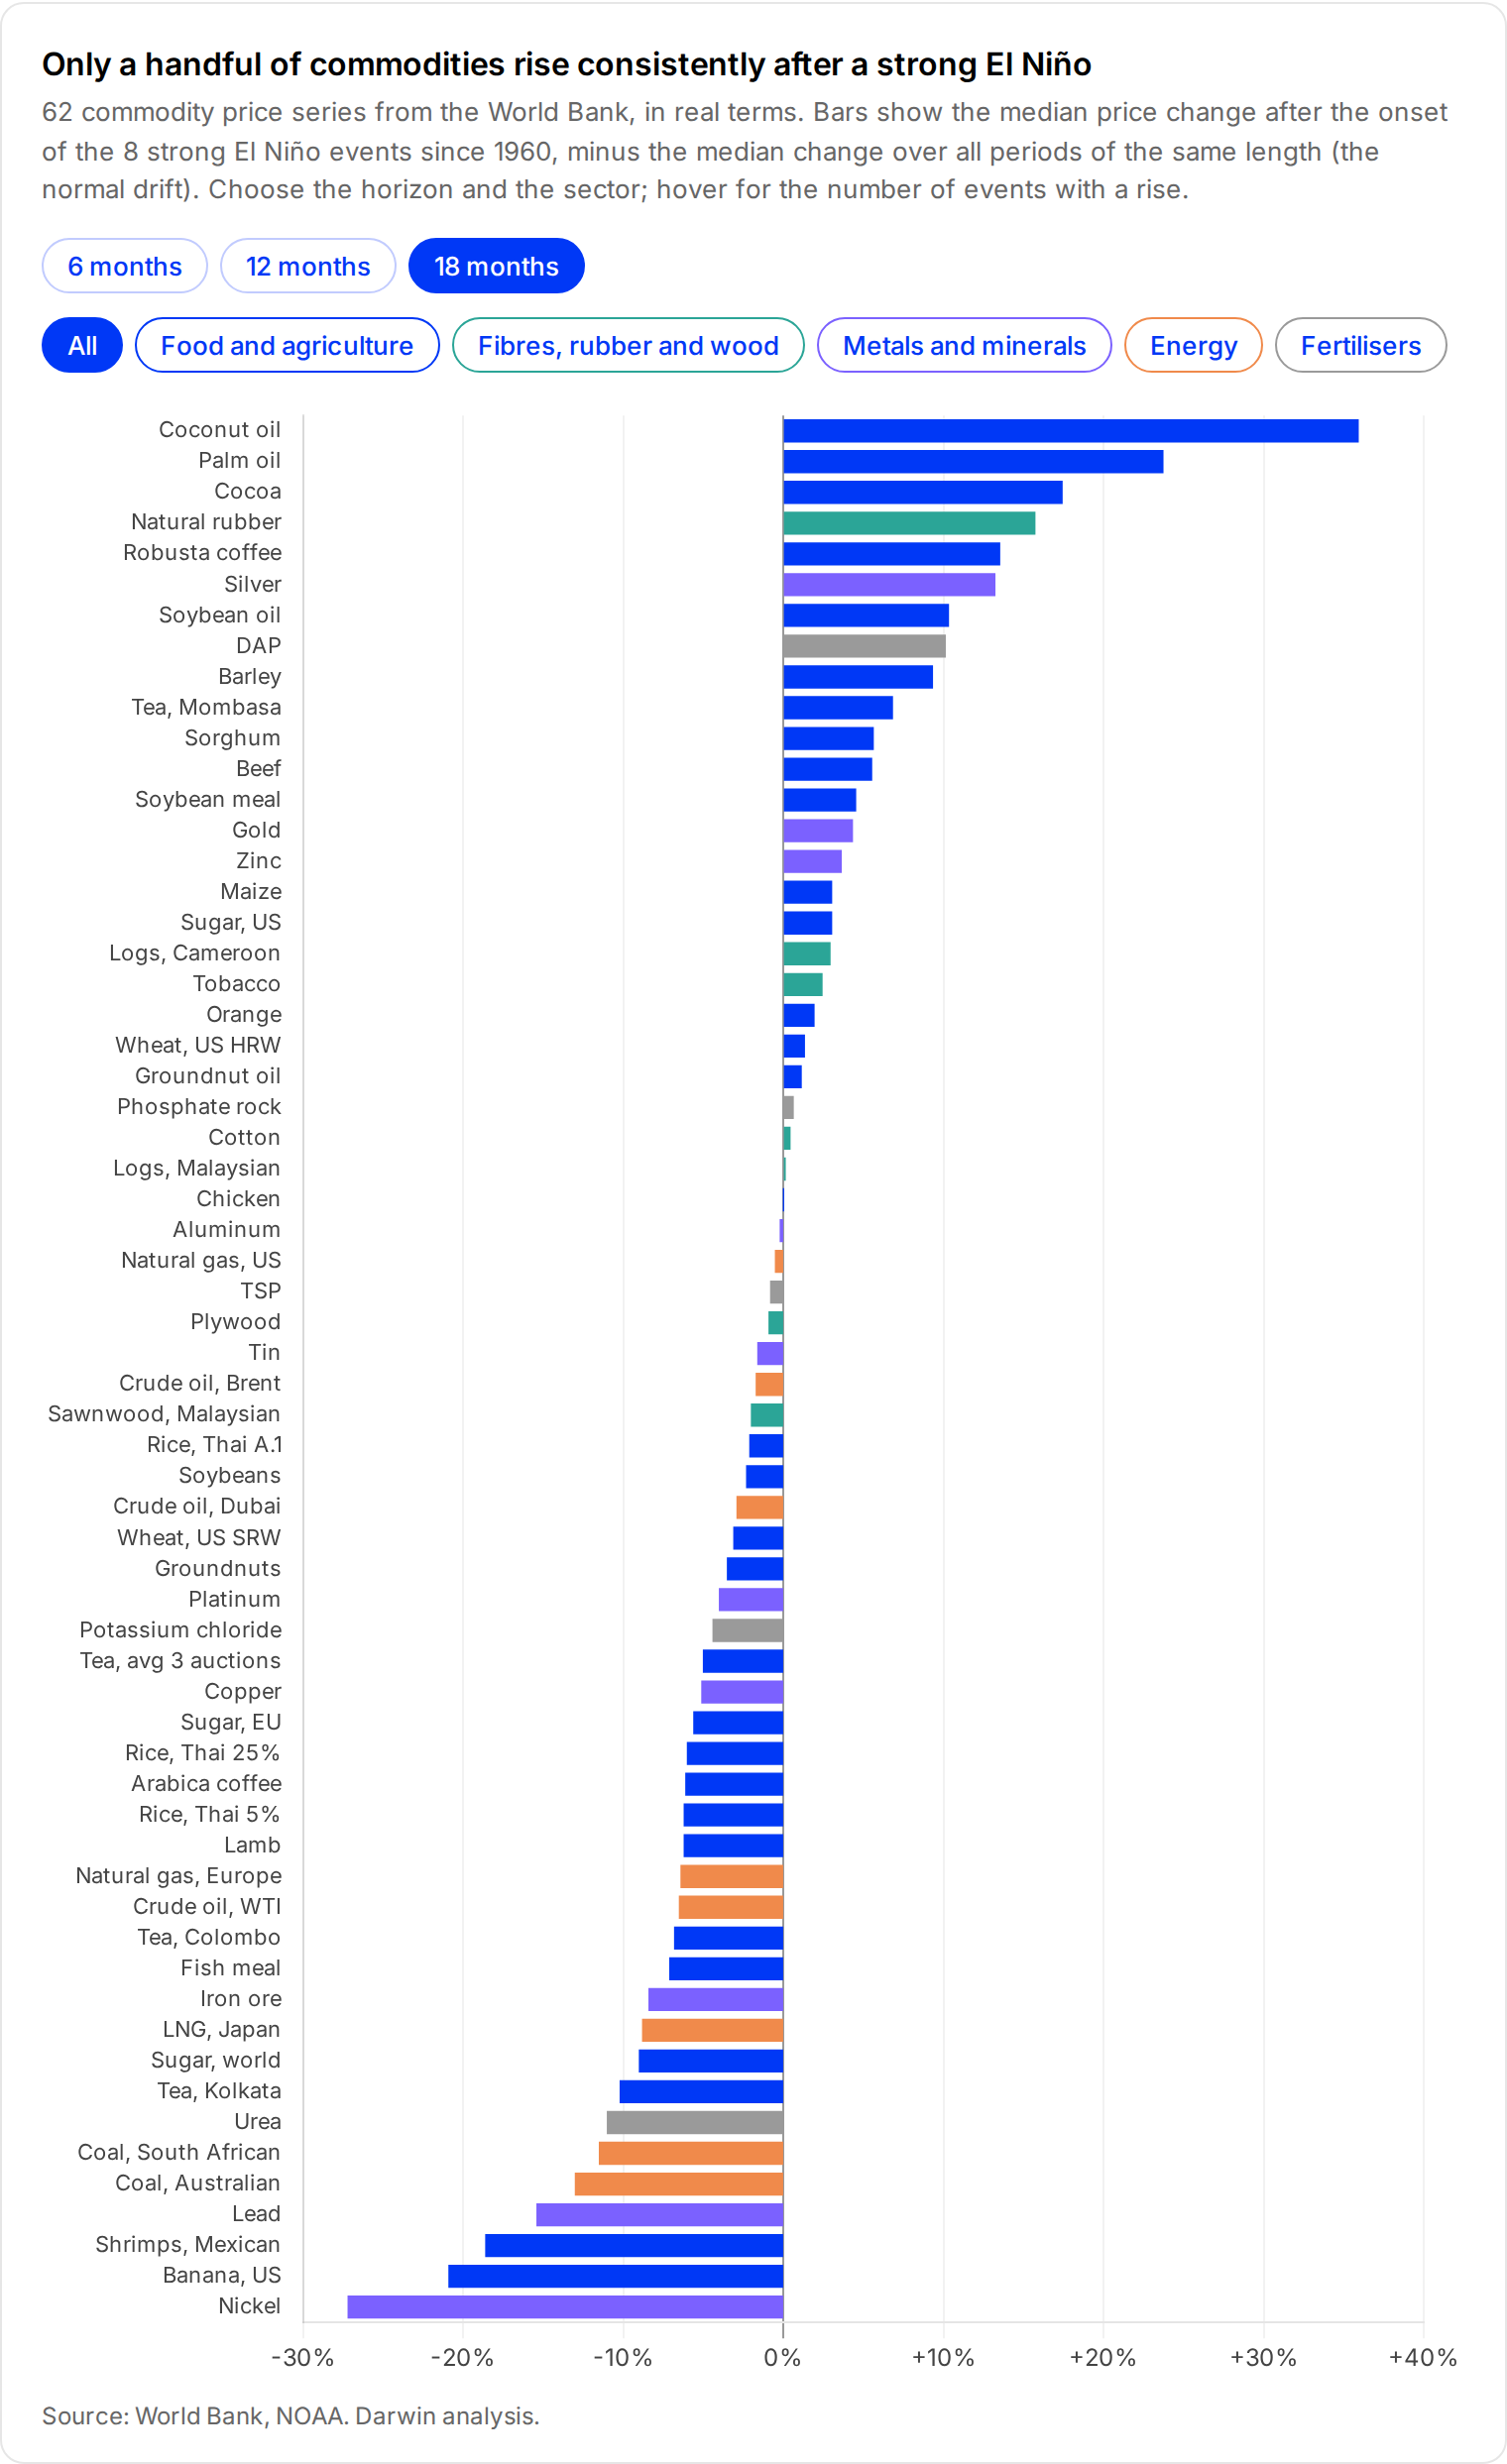
- Only 5 commodities react consistently at world level. Across 62 commodities and 8 strong El Niño events since 1960, only palm oil, coconut oil, cocoa, robusta coffee and natural rubber saw their prices rise after most events.
- Most of the risk is local. El Niño disrupts hydropower in southern Africa and Colombia, shipping through the Panama Canal, coastal infrastructure in Peru and Ecuador, and crops in Southeast Asia, India and southern Africa.
- The effects arrive over the next 12 months. Fisheries, cocoa and Indian crops are already affected; power, coastal floods and the next harvests follow in the coming months, and palm oil and rubber in 2027.
- Exposure depends on location. Companies and investors need to know which of their sites and suppliers sit in the affected regions, which Darwin measures from site lists and purchasing data.
A very strong El Niño is under way in the tropical Pacific, and early disruptions are already visible in harvests, fisheries, hydropower and shipping. This article looks at what past strong events did to commodity markets, to operations in several sectors and to the producing regions behind supply chains, and explains how a company or an investor can measure its own exposure.
Read the full article
Enter your email address to read the rest of this publication and explore the interactive visuals.
Context
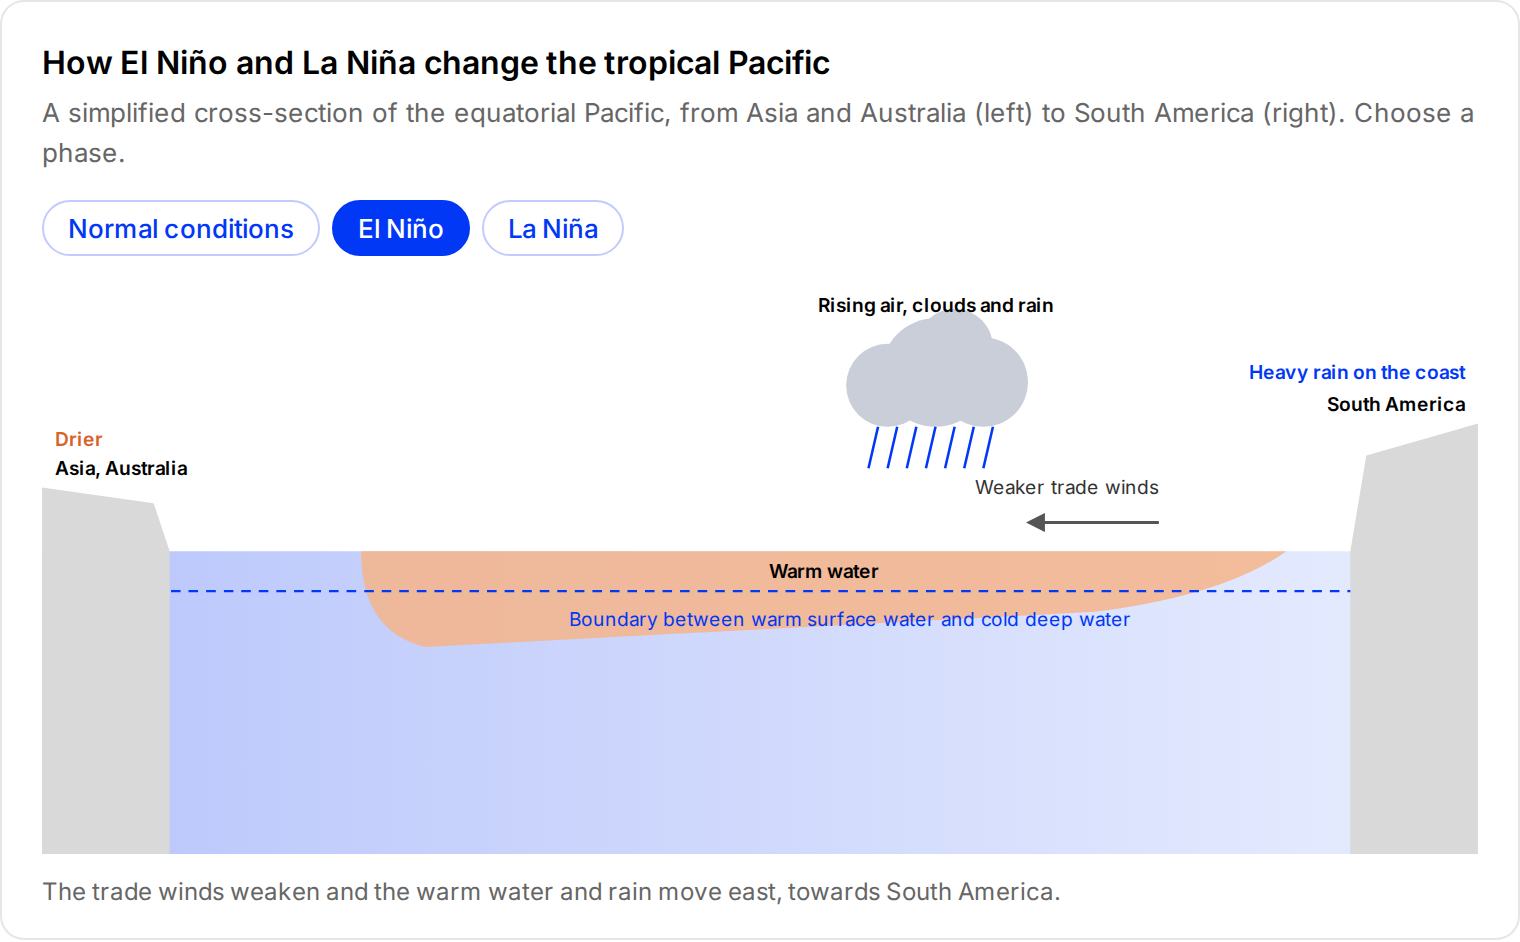
El Niño is a periodic warming of the surface of the tropical Pacific Ocean. In normal conditions, trade winds blowing from east to west push warm surface water towards Asia and Australia, where it feeds heavy rains. Every 2 to 7 years these winds weaken, the warm water flows back east and the rain follows it. Southeast Asia, Australia, India and southern Africa then tend to become drier, while the coasts of Peru and Ecuador receive heavy rain. La Niña is the opposite phase: the winds strengthen, the eastern Pacific cools and the effects are roughly reversed. Together, the 2 phases form a natural cycle called the El Niño–Southern Oscillation (ENSO).
How El Niño and La Niña change the tropical Pacific
A simplified cross-section of the equatorial Pacific, from Asia and Australia (left) to South America (right). Choose a phase.
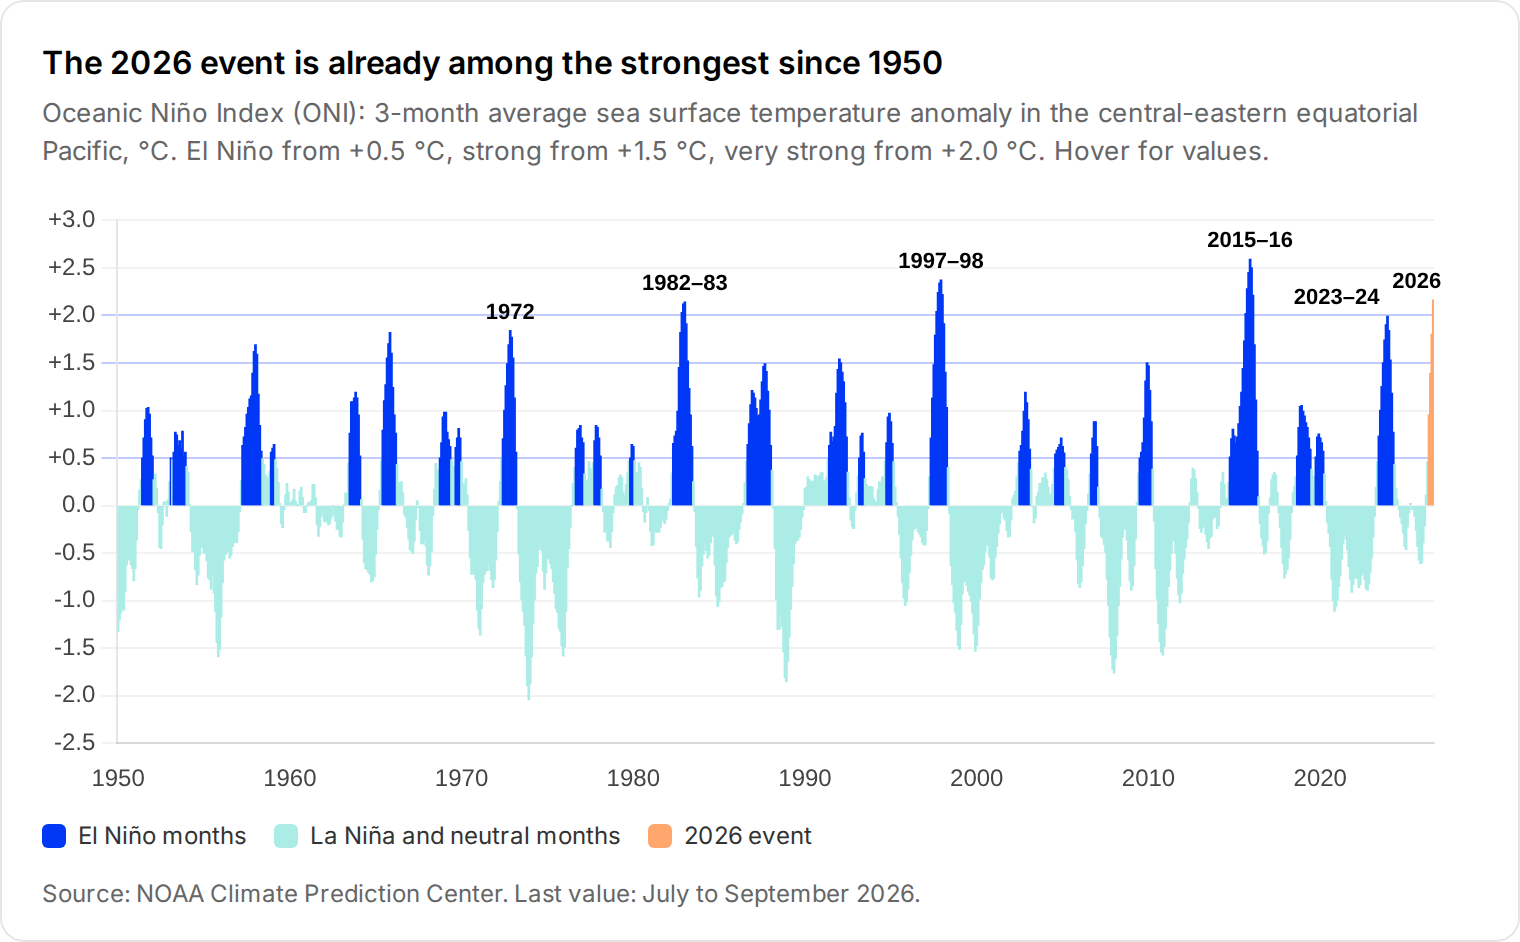
The event that started in spring 2026 is already among the strongest on record. The US National Oceanic and Atmospheric Administration (NOAA) considers it likely to peak this winter above any El Niño measured since 1950 and expects it to last into spring 2027.
The 2026 event is already among the strongest since 1950
Oceanic Niño Index (ONI): 3-month average sea surface temperature anomaly in the central-eastern equatorial Pacific, °C. El Niño from +0.5 °C, strong from +1.5 °C, very strong from +2.0 °C. Hover for values.
Source: NOAA Climate Prediction Center. Last value: July to September 2026.
The earliest effects are already visible. India's monsoon was the weakest since 2015, Peru cancelled an anchovy fishing season, the Panama Canal has limited the size of ships to protect its reservoir, and Zambia, Zimbabwe and Colombia are preparing for lower hydropower output. El Niño is not the only force acting on markets this year, as the disruption around the Strait of Hormuz has also pushed up energy and food prices.
What past El Niño events did to commodity markets
We compared the prices of 62 commodities, from food to fibres, fertilisers, metals and energy, after each of the 8 strong El Niño events since 1960 with their usual evolution over periods of the same length. Other shocks of each period are not removed, so what matters most is how many events point in the same direction. The method is described in the appendix.
Only a handful of commodities rise consistently after a strong El Niño
62 commodity price series from the World Bank, in real terms. Bars show the median price change after the onset of the 8 strong El Niño events since 1960, minus the median change over all periods of the same length (the normal drift). Choose the horizon and the sector; hover for the number of events with a rise.
Source: World Bank, NOAA. Darwin analysis.
5 tropical tree crops stand out
Coconut oil, palm oil, cocoa, robusta coffee and natural rubber are the only commodities whose price rose after most strong events and stayed well above its usual level a year and a half later. All 5 are perennial crops concentrated in the tropical regions that El Niño dries out, and none can be replanted quickly when a harvest fails. This matches the academic literature, which identifies vegetable oils as the commodity group most reliably affected by El Niño (Brunner, 2002; Ubilava, 2018). Recent research also finds that the effect of El Niño on food commodity prices has weakened since the 1970s and 1980s, as producers and trade have adapted, and can even reverse for some commodities (Borrallo et al., 2024).
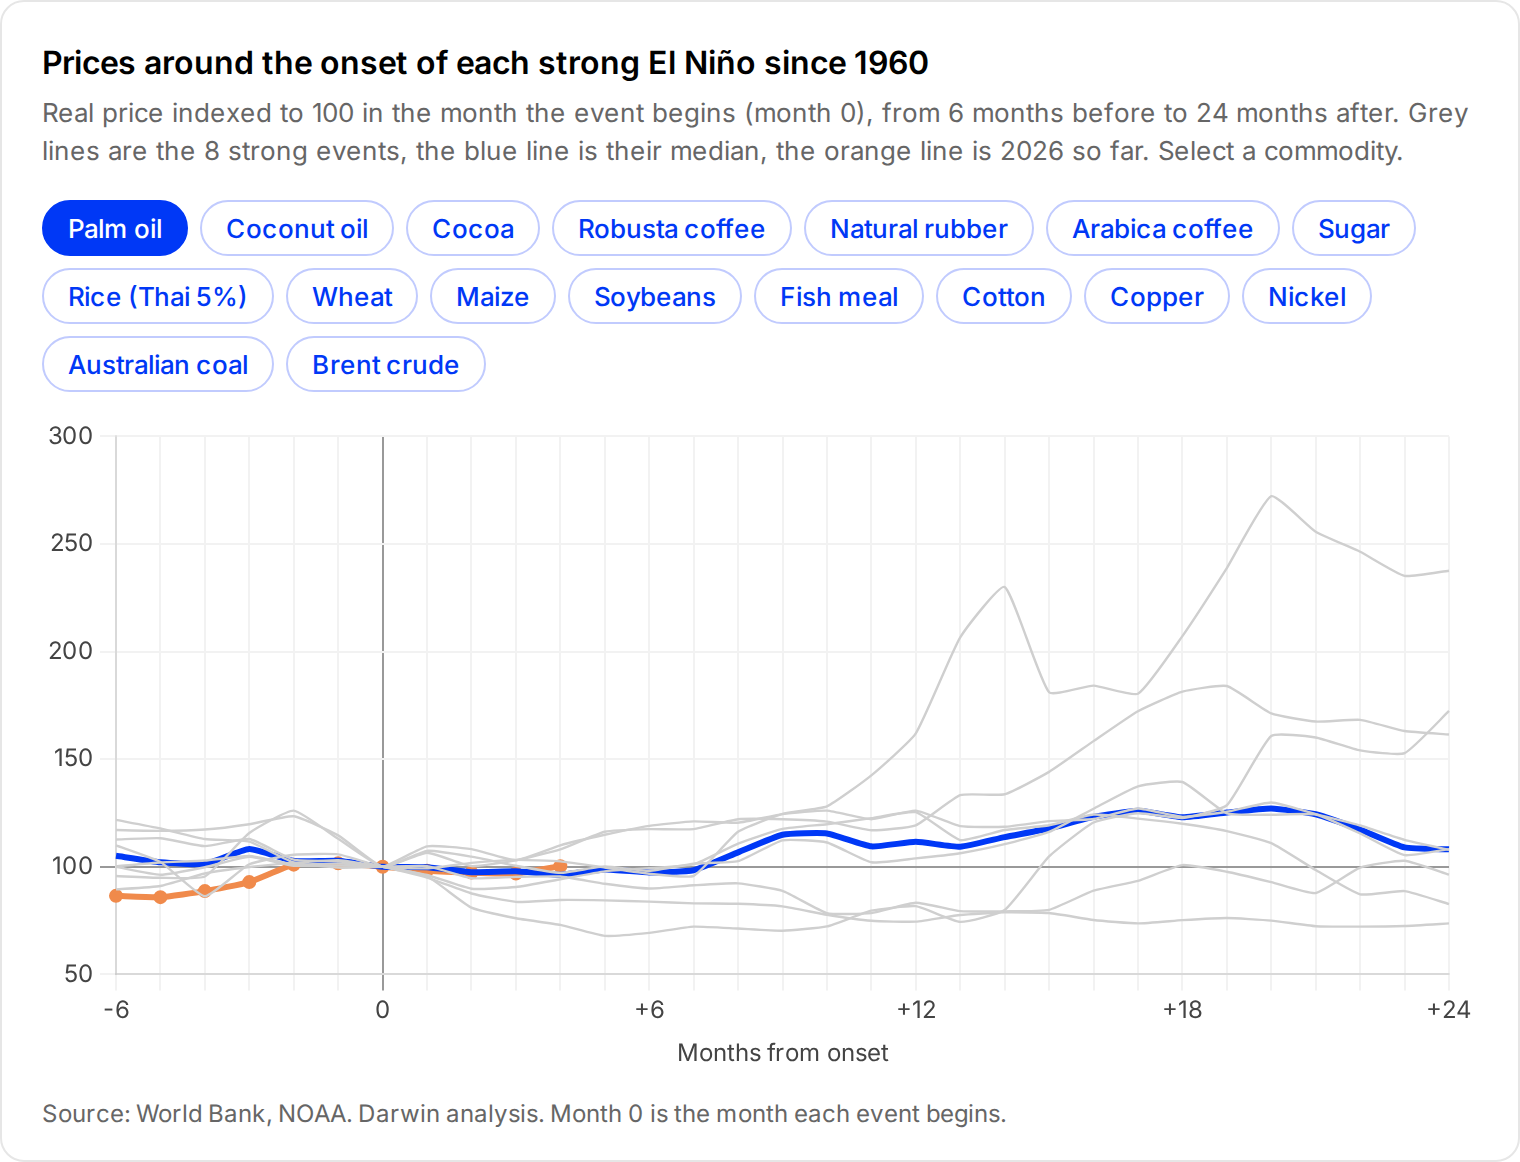
Prices around the onset of each strong El Niño since 1960
Real price indexed to 100 in the month the event begins (month 0), from 6 months before to 24 months after. Grey lines are the 8 strong events, the blue line is their median, the orange line is 2026 so far. Select a commodity.
Source: World Bank, NOAA. Darwin analysis. Month 0 is the month each event begins.
Grain, sugar and arabica coffee prices do not move consistently
El Niño damages some producers of these crops and helps others in the same season. It brings drought to Australia, India and southern Africa but often favourable rains to Argentina, southern Brazil and the United States. Because good and poor harvests occur in different regions in the same season, the effects partly offset each other at world level (Anderson et al., 2018), which is why grain prices move little. For these crops, the risk is regional, and trade policy can amplify it, as when India restricted rice exports in 2023.
Metals, energy and fertilisers show no consistent price increase
None of the metal, energy or fertiliser prices rose consistently over the 18 months that follow a strong event. Copper and tin were higher 12 months after most events but had given the gain back 6 months later, and energy prices tended to be lower than usual. This is consistent with the slowdown in global growth that follows strong events (Callahan and Mankin, 2023), although 8 events are too few to separate it from other causes. For these sectors, as the next section shows, the risk sits in operations rather than in prices.
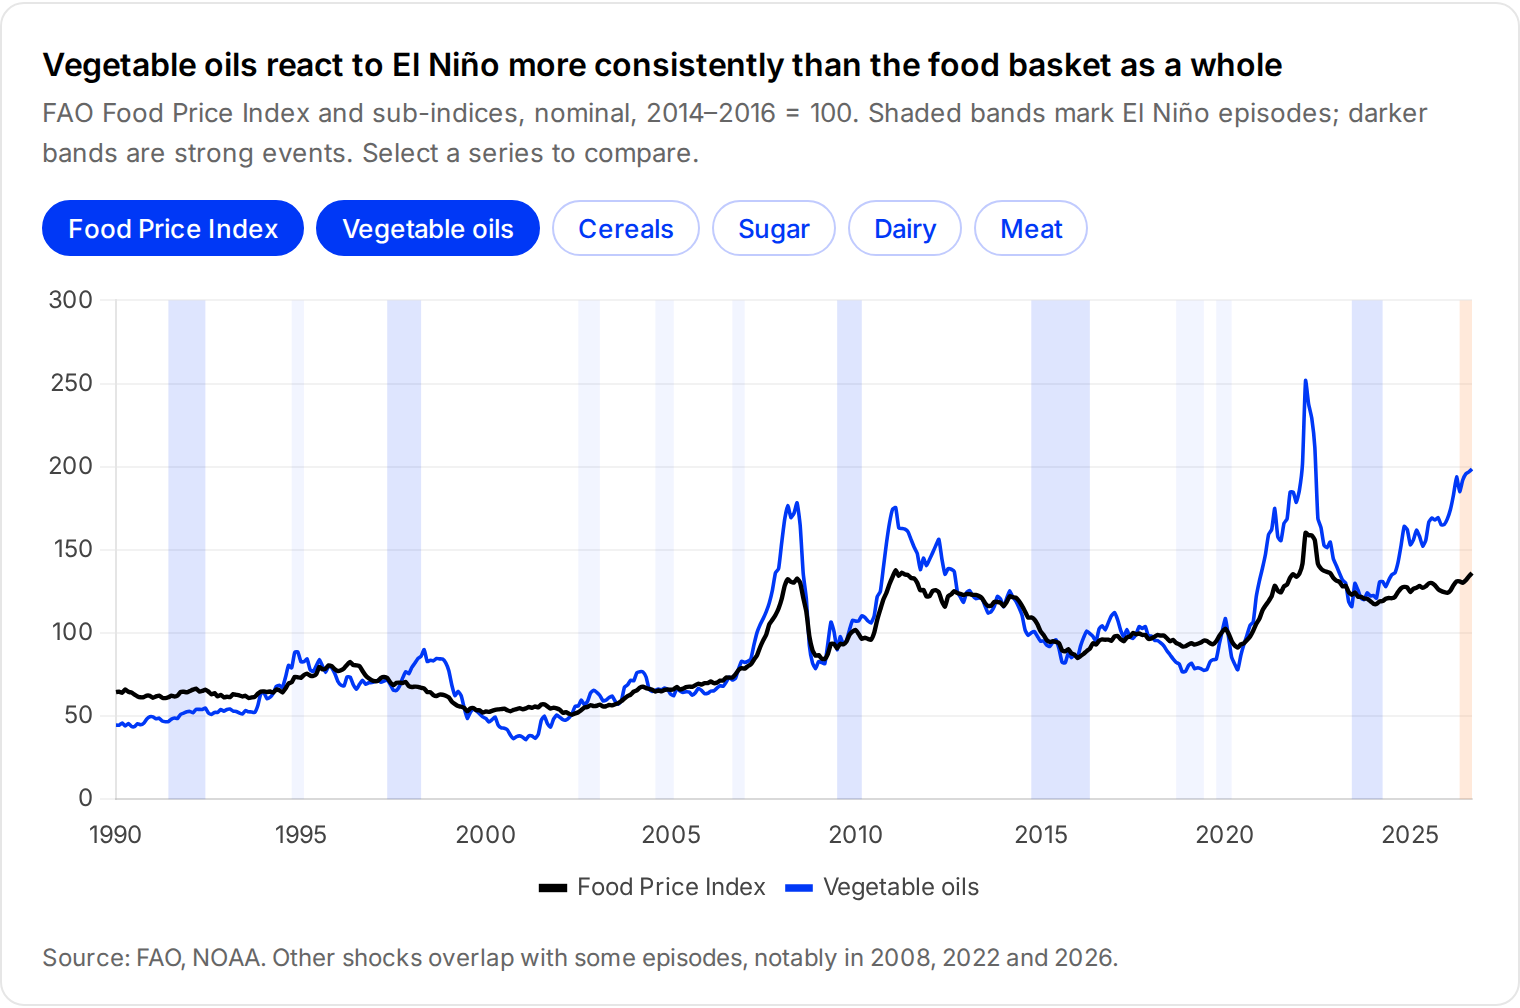
Vegetable oils react to El Niño more consistently than the food basket as a whole
FAO Food Price Index and sub-indices, nominal, 2014–2016 = 100. Shaded bands mark El Niño episodes; darker bands are strong events. Select a series to compare.
Source: FAO, NOAA. Other shocks overlap with some episodes, notably in 2008, 2022 and 2026.
Timing differs by commodity
Fishmeal, cocoa and coffee prices move as soon as the market expects a shortfall, often before the official start of the event: between May and September 2026, the fishmeal price rose by more than 40%. Palm oil reacts later, when the smaller harvest appears in production statistics, usually 9 to 16 months after the drought.
Beyond prices: where El Niño disrupts operations
A local disruption moves world prices only when the affected region weighs heavily in world supply and cannot be replaced quickly, as with palm oil from Indonesia and Malaysia, cocoa from West Africa or fishmeal from Peru. For most other activities, the effect stays local: low reservoirs raise wholesale electricity prices in Colombia, draft limits in the Panama Canal force ships to carry less cargo, and floods in Peru damage roads and buildings. These costs appear in local prices and in the accounts of the companies and funds that own or depend on the assets, rather than in global commodity markets.
| Sector | How El Niño hits | Past evidence | Signal in 2026 |
|---|---|---|---|
| Energy | Lower rainfall empties hydropower reservoirs while heat raises demand; power-intensive industries, such as the copper mines of Zambia, are exposed to rationing when reservoirs run low | In 2024, Lake Kariba fell to 13% of usable storage and Zambia had power cuts of up to 21 hours a day | Water allocated to power at Kariba cut by 36% for 2027; Colombia's grid operator expects stress from December to April |
| Shipping and logistics | Low water in canals and rivers limits ship size and traffic | In 2023–24, Panama Canal transits fell to as few as 22 a day | Lower draft limits since July and fewer daily transits since September |
| Infrastructure, real estate and insurance | Heavy rain on the dry Pacific coast of South America causes floods and landslides | The 1997–98 event caused $7.5bn of damage in the Andean countries | Very warm waters off Peru; flood risk in the January to March rainy season |
| Forests, plantations and land | Drought turns land clearing fires into large fires on peat | In 2015, fires burned 2.6 million hectares in Indonesia and cost $16.1bn | Indonesia drier than normal since mid-year, with fire hotspots rising |
| Fisheries and animal feed | Warm water stops the upwelling that feeds anchovy off Peru | The 1st anchovy season of 2023 was cancelled | The 2nd season of 2026 was cancelled; fishmeal prices up sharply since May |
| Agriculture and food | Drought or excess rain cuts yields in exposed regions | Palm oil, cocoa, robusta and rubber prices rose after most strong events | Weak Indian monsoon; lower Ivorian cocoa main crop expected |
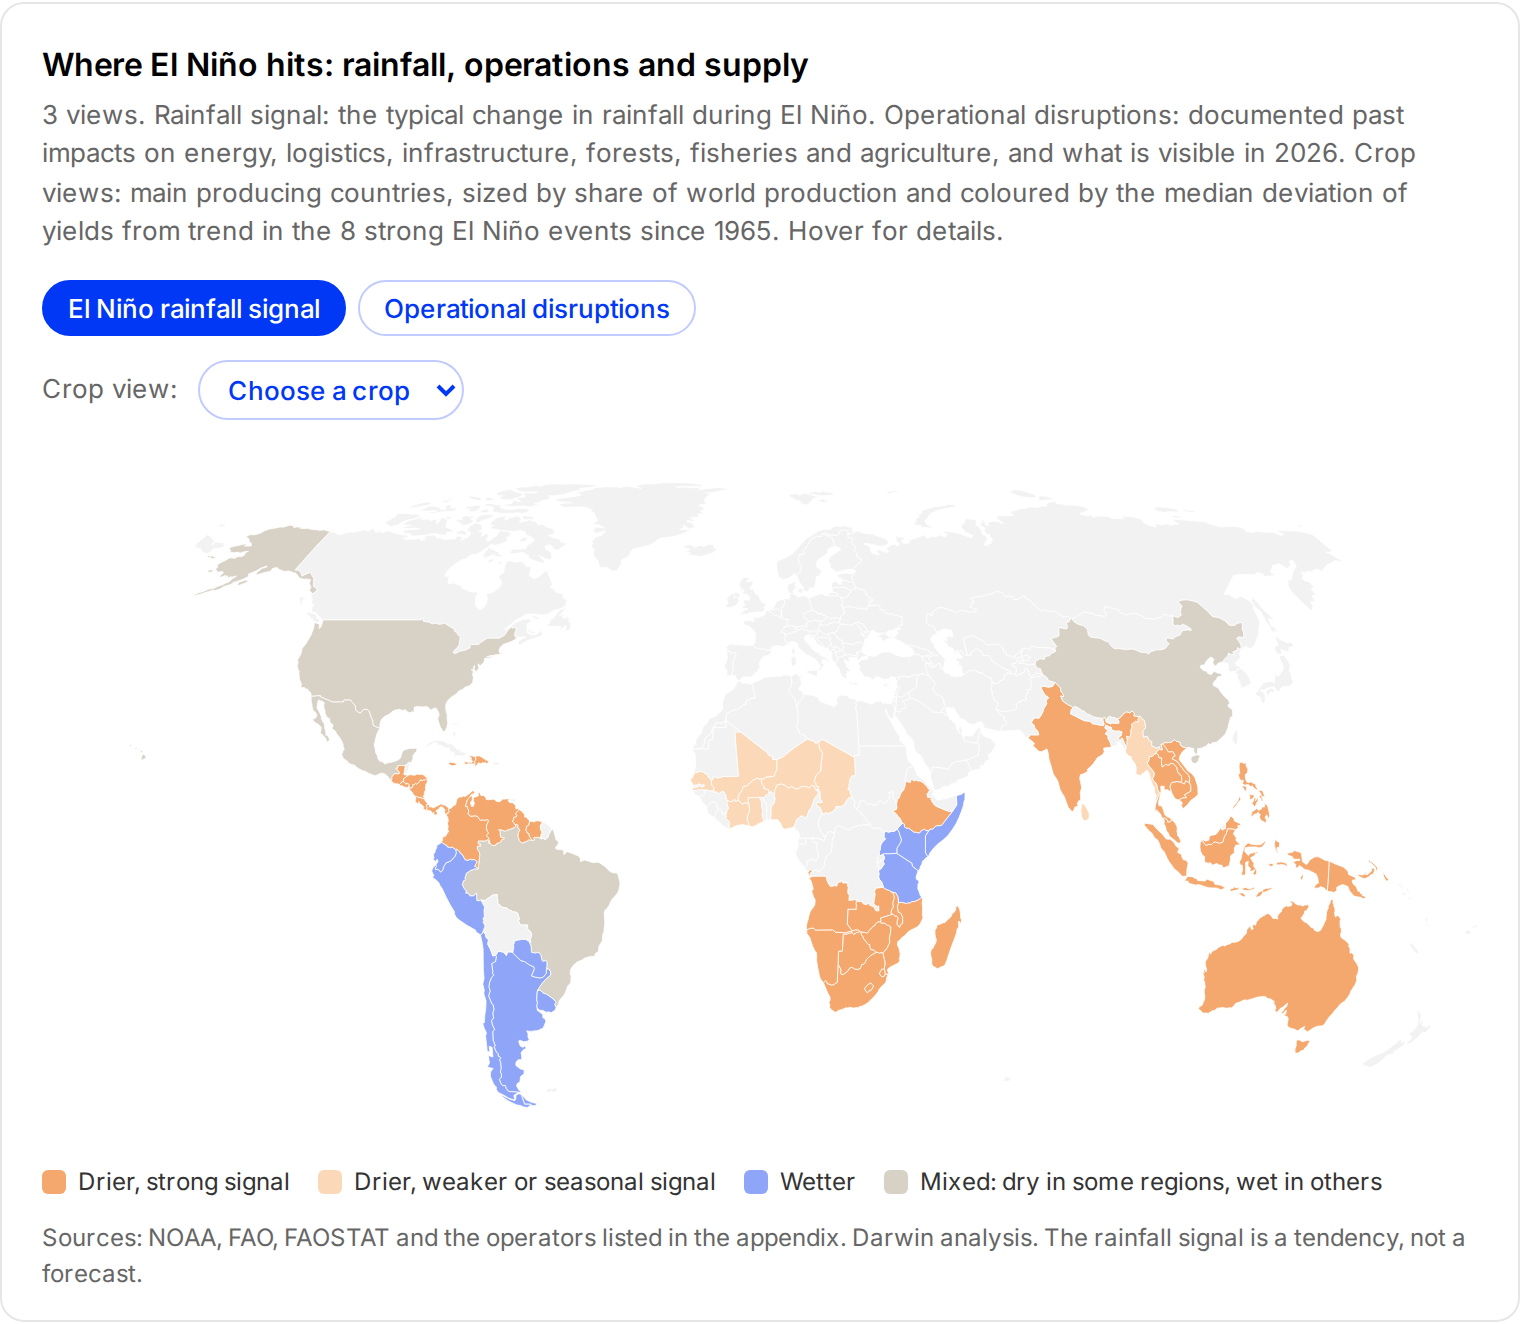
Where El Niño hits: rainfall, operations and supply
3 views. Rainfall signal: the typical change in rainfall during El Niño. Operational disruptions: documented past impacts on energy, logistics, infrastructure, forests, fisheries and agriculture, and what is visible in 2026. Crop views: main producing countries, sized by share of world production and coloured by the median deviation of yields from trend in the 8 strong El Niño events since 1965. Hover for details.
Sources: NOAA, FAO, FAOSTAT and the operators listed in the appendix. Darwin analysis. The rainfall signal is a tendency, not a forecast.
Where the 2026–27 event can hit supply chains
Prices reflect the global balance of supply and demand, but a buyer is exposed through specific origins. We measured how yields in the main producing countries of 24 crops deviated from their trend during the 8 strong events, using national statistics since 1961, taking for each crop the harvest that follows the dry season.
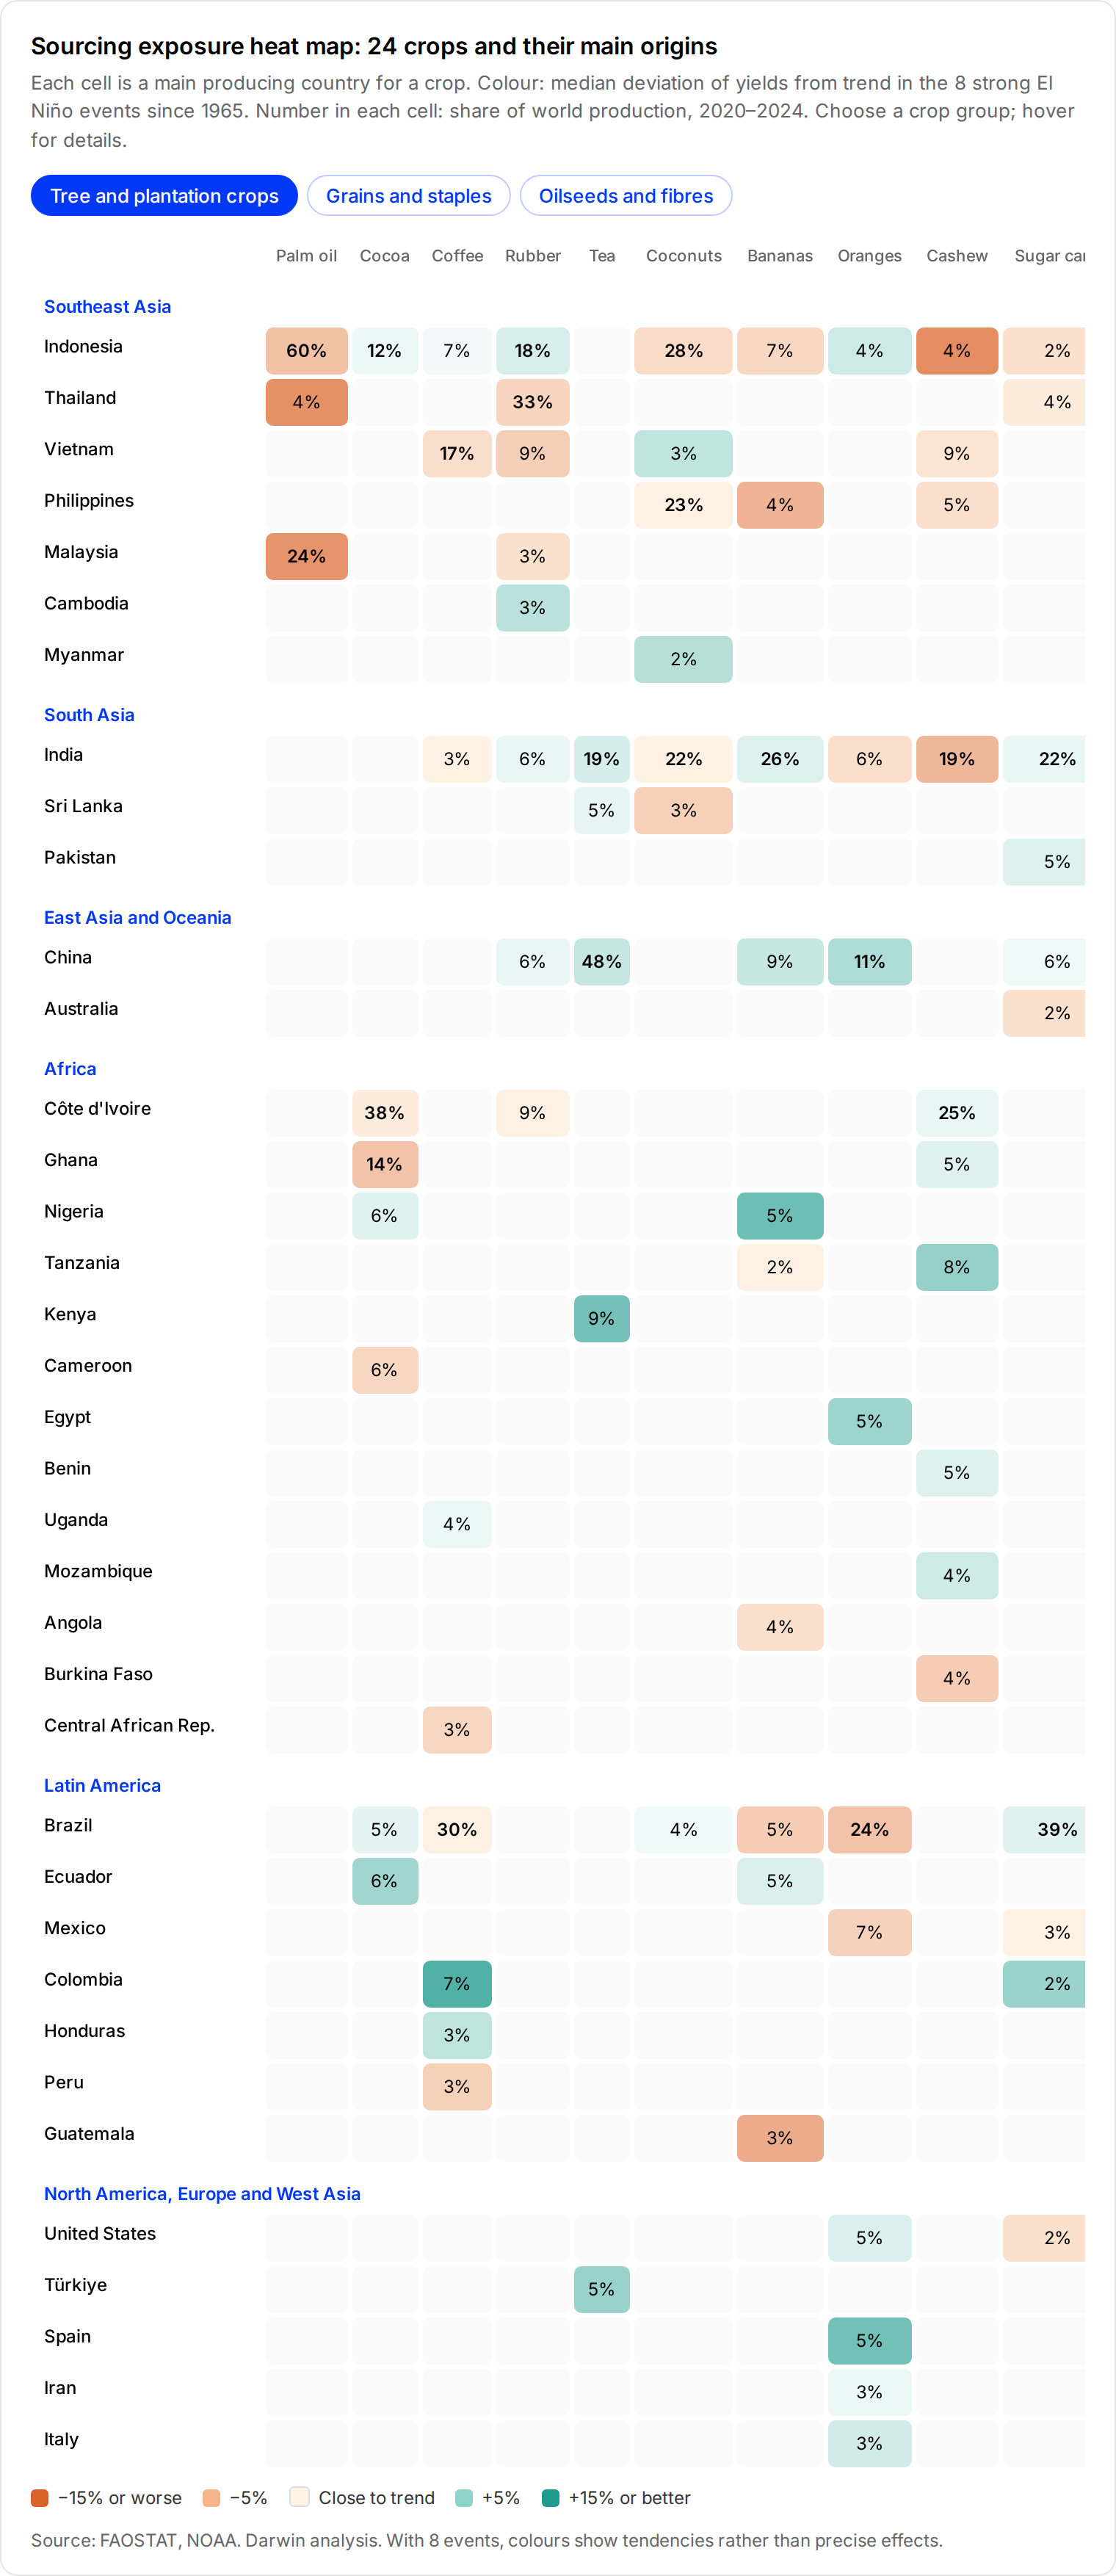
Sourcing exposure heat map: 24 crops and their main origins
Each cell is a main producing country for a crop. Colour: median deviation of yields from trend in the 8 strong El Niño events since 1965. Number in each cell: share of world production, 2020–2024. Choose a crop group; hover for details.
Source: FAOSTAT, NOAA. Darwin analysis. With 8 events, colours show tendencies rather than precise effects.
The origins with the most consistent losses
A limited number of origins had yields below trend in at least 6 of the 8 events:
- Southeast Asia: palm oil in Malaysia, Thailand and Indonesia, natural rubber in Thailand, and rice and bananas in the Philippines. The 3 palm oil countries supply 87% of world output, which leaves little room to switch origin, and Thailand grows about 33% of the world's rubber.
- India: groundnuts, millet, sorghum, soybeans, cotton and cashew, mostly rainfed. India grows about 20% of the world's cotton and groundnuts.
- Southern Africa: South African maize shows the largest losses of all the crops analysed, with yields about 20% below trend in a typical strong event.
- Eastern Australia: wheat yields were below trend in most strong events. The 2026 season shows the limits of the pattern: after a wet winter in the south-east, the Australian Bureau of Agricultural and Resource Economics and Sciences (ABARES) raised its winter crop forecast in September.
- Latin America: oranges in Brazil, about 25% of world production, were below trend in all 8 events, and bananas in Guatemala in most of them.
Some exposures are weaker than the price history suggests. Côte d'Ivoire, which grows 38% of the world's cocoa, shows only a small signal in national statistics, and so do Vietnam's coffee yields. In the other direction, Argentine soybeans and maize, US maize and Kenyan tea were above trend in most events, which is why El Niño rarely creates a global shortage of grains while it can create severe local ones.
| Exposure | Where to look | When the effect usually shows | Signal in 2026 so far |
|---|---|---|---|
| Palm oil and rubber | Indonesia, Malaysia, Thailand | 9 to 16 months after the drought, in 2027 | Indonesia drier than normal since mid-year; Malaysian producers expect lower output in 2027 |
| Cocoa | Côte d'Ivoire, Ghana | During the October to March main crop | Prices up sharply since February; lower Ivorian crop expected |
| Fishmeal and fish oil | Peru, Chile | Immediately | 2nd anchovy season cancelled; prices up sharply since May |
| Rice, groundnuts, cotton | India, Philippines, Thailand | Harvests at the end of 2026 | Weakest monsoon since 2015; FAO rice index rising |
| Maize and power | Zambia, Zimbabwe, South Africa | Harvest and reservoir levels in early 2027 | Dry outlook for the rainy season; Kariba allocation cut |
What this means for companies and investors
Exposure differs for buyers and for asset owners
A buyer of a widely traded grain is mainly exposed to the world price, which El Niño moves only modestly. A buyer tied to specific origins, such as a chocolate maker with traceable cocoa, is exposed to the volume and quality of those origins. An owner of a hydropower plant, a factory, a port or a building is exposed to the physical conditions at its own site, whatever happens to world prices.
Exposure depends on location more than on sector
Across 62 commodities, only 5 tropical tree crops show a consistent price increase, and most other effects fall on specific reservoirs, canals, coasts and plantations. 2 hydropower plants or 2 real estate portfolios can face opposite risks depending on where they are, since El Niño dries out southern Africa and Colombia while it brings floods to the coast of Peru and Ecuador. An analysis of sites and sourcing by location is needed to see whether a company or a portfolio is concentrated in these places.
The effects will be felt over the next 12 months, at different times
The effects arrive at different times over the next 12 months, from fisheries and cocoa now to palm oil and rubber in 2027. A company that knows where its sites and volumes are still has time to review stocks, contracts, energy supply and alternative origins.
Effects spread to other sectors
The same drought can hit power, industry and food in a single region, and the effects spread through feed, energy and trade policy: a shortfall in Peruvian anchovy raises the cost of fish farming feed, and lower palm oil output competes with Indonesia's biodiesel mandate for the same volumes.
Climate change increases the cost of strong events
Callahan and Mankin (2023) estimate that the 1997–98 El Niño alone reduced global income by $5.7 trillion over the following years, mainly in tropical countries, and that stronger El Niño events in a warmer climate would make these losses much larger over the century. The regions affected by El Niño are also largely those where climate projections show more frequent droughts, heat and floods, so the data used to assess exposure to this event can also serve a longer-term climate and nature adaptation plan.
For a company or a fund, the useful question is which of its sites, suppliers and volumes are located in the regions affected by El Niño, and at what time of year.
How Darwin measures exposure
The analysis above was done at country level with public data. A company or a fund needs it on its own sites, suppliers and revenue. Darwin builds it from data most companies already hold: a list of sites with their address and type, and a list of purchased raw materials with their country of origin.
| Data from the company | What Darwin produces | What it is used for |
|---|---|---|
| Sites with address and type (plant, mine, warehouse, building, farm, infrastructure) | Site exposure. Exposure to 15 climate hazards, including drought, water stress, extreme heat, extreme precipitation and floods, and 9 nature-related physical risks such as loss of water purification, soil retention or pollination | Locate assets in regions affected by El Niño and long-term climate change |
| Revenue or asset value by site | Resilience. Expected annual loss in euros per site, today and in 2035, 2050 and 2080, under 3 IPCC climate scenarios | Size the financial stake and rank sites |
| Purchased raw materials with sourcing country, in volume or spend | Sourcing risk. A nature and climate risk score for each commodity and origin | Identify purchases from exposed origins and their concentration |
| Purchased volumes by commodity | Commodity prices. Weekly market prices from the World Bank, European Commission and US Department of Agriculture, with the euro value of volumes bought and the 3-month and 1-year trend | Follow commodities whose prices are moving, such as those exposed to El Niño |
| Adaptation options such as diversifying origins, water management or site protection | Trajectory. Actions costed in euros, from a catalogue of around 3,000 | Build an adaptation plan covering both nature and climate |
Darwin does not forecast El Niño itself. It shows where a company's sites, suppliers and revenue are located relative to the regions that El Niño and longer-term climate change affect, and how the market prices of its purchased commodities are moving. A seasonal forecast, such as NOAA's monthly outlook, can then be read against the company's own footprint rather than against a sector average.
The same analysis works across a portfolio
An infrastructure fund can see which of its hydropower, water, port or transport assets sit in the regions at risk this season. A private equity fund can see which of its industrial, food or consumer companies depend on exposed sites or origins, and where that exposure is concentrated, before it shows in margins. The same view supports due diligence on new acquisitions and the dialogue with portfolio companies on adaptation.
Measure your exposure to El Niño
Send us your list of sites and your main purchased raw materials with their countries of origin. We will show which assets and volumes sit in exposed regions, for a single company or across a fund's portfolio.
Get in touchData, method and sources
Method
The analyses in this article are Darwin's own calculations on public data:
- El Niño events: strong events are those whose Oceanic Niño Index (ONI) peaked at +1.5 °C or more since 1960: 1965, 1972, 1982, 1991, 1997, 2009, 2014–16 and 2023. NOAA also publishes a relative index that removes the general warming of the tropics; on that measure the 2026 event is slightly weaker, but still expected to be very strong.
- Prices: 62 monthly World Bank price series, adjusted for inflation, compared after each event with their usual change over the same period. The results hold when 2009, whose peak sits exactly at the threshold, is excluded.
- Yields: yields of the main producing countries of 24 crops, compared with their trend over the years around each event, for the harvest that follows the dry season.
- Limits: 8 events, national averages that hide regional effects, and other shocks that coincide with some events. Results describe tendencies, not forecasts.
Main data sources
- NOAA Climate Prediction Center: Oceanic Niño Index and ENSO Diagnostic Discussion, October 2026; IRI, Columbia University, ENSO Forecast, October 2026.
- World Bank, Commodity Price Data (Pink Sheet); FAO, Food Price Index; FAO, FAOSTAT crop production statistics.
- India Meteorological Department; ABARES; Peru Ministry of Production and IFFO; Panama Canal Authority; Zambezi River Authority; XM (Colombia); FAO and WFP, El Niño Anticipatory Action Appeal, 2026.
Research
- Anderson, W., Seager, R., Baethgen, W. and Cane, M. (2018). Trans-Pacific ENSO teleconnections pose a correlated risk to agriculture. Agricultural and Forest Meteorology.
- Borrallo, F., Cuadro-Sáez, L., Ghirelli, C. and Pérez, J. J. (2024). El Niño and La Niña: revisiting the impact on food commodity prices and euro area consumer prices. Banco de España Working Paper 2432.
- Brunner, A. D. (2002). El Niño and world primary commodity prices: warm water or hot air? Review of Economics and Statistics, 84(1), 176–183.
- Callahan, C. W. and Mankin, J. S. (2023). Persistent effect of El Niño on global economic growth. Science, 380(6649), 1064–1069.
- Glauber, A. J. et al. (2016). The Cost of Fire: An Economic Analysis of Indonesia's 2015 Fire Crisis. World Bank.
- Jovel, J. R. (2001). The impact of the 1997–1998 El Niño on the Andean Community of Nations. Andean Development Corporation (CAF).
- Ropelewski, C. F. and Halpert, M. S. (1987). Global and regional scale precipitation patterns associated with the El Niño/Southern Oscillation. Monthly Weather Review, 115(8), 1606–1626.
- Ubilava, D. (2018). The role of El Niño Southern Oscillation in commodity price movement and predictability. American Journal of Agricultural Economics, 100(1), 239–263.